
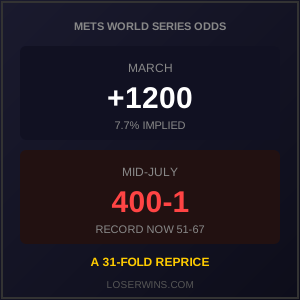
The Mets are 51-67 through Saturday, last in the National League East, 11 games behind the final wild card spot. Back in March they opened at +1200 at BetMGM and +1300 at DraftKings to win the World Series, third or fourth shortest on the board depending on the book. ESPN’s second-half preview put it about as plainly as you can, calling them in the running for the worst team, dollar for dollar, ever.
That March price wasn’t obviously wrong when it went up. What’s worth looking at is how far it had to travel afterward, and how little of the movement is actually documented.
Where the Mets World Series Odds Started
On Opening Day the board ran Dodgers +220 at BetMGM, then Yankees +1000, Mets +1200, Mariners +1300, Blue Jays +1400. DraftKings had the Dodgers at +230, the Yankees +1000, then Mariners +1200 and Mets +1300. Sports Illustrated later put New York at 13-1 before the season. That matches. So call it a shade over 7 percent implied, in the neighborhood of a one-in-fourteen shot.
Payroll was part of why. It’s also where people get sloppy, so here’s the careful version: by cash payroll discounted for deferrals, the Mets led baseball at roughly $352 million. By competitive balance tax payroll, the figure the luxury tax actually runs on, the Dodgers led at somewhere between $413 million and $431 million depending on whose tracker you read, with the Mets north of $375 million by ESPN’s count. Juan Soto alone draws a league-high $61.9 million this year. Whether New York was the biggest spender in the sport therefore depends entirely on which column you point at.
April Told the Story
Yahoo Sports logged the start at 10-21, a 12-game losing streak sitting inside it. The projection systems reacted fast. FanGraphs had them at 65.7 percent to make the playoffs coming into the season, third-best in the National League, and down to 42.9 percent by April 21. Yahoo’s numbers ran 38 percent to win the East and 80 percent to reach the postseason preseason, then 3 percent and 27 percent by May 22.
Notice those two systems opened 14 points apart on the same team. Sixty-six against eighty, before a pitch. That gap is a decent reminder that a projection is a model output rather than a measurement, and reasonable models disagree by a lot.
The Fall, in Two Waypoints
For the title price I have March and I have the All-Star break, and not much in between. Sports Illustrated had the Mets at 400-1 to win it all in mid-July. Run the implied numbers and the move is severe: about 7.7 percent down to roughly a quarter of one percent, a factor of nearly 31.
The postseason market tells a similar story from a different angle. Yahoo’s model had them 80 percent to play in October when the season opened, and as of Friday BetMGM was posting +3500 for the Mets to reach the postseason, an implied 2.78 percent. Same question, same team, four and a half months apart.
What Two Numbers Cannot Tell You
Two waypoints describe a fall. They don’t describe when it happened.
I can’t tell you which week the book number finished catching up, because the published prices I can find jump from Opening Day to mid-July with a gap in the middle. That matters more than it might seem. The free, daily-updating models had most of the collapse registered inside three weeks, with FanGraphs cutting 23 points by April 21. If the betting number kept pace, the market did its job. If it lagged by a month or two, somebody was quoting a stale price on a team that had already told everyone what it was. From the outside I can’t distinguish those, and anyone claiming otherwise from these same public sources is guessing. This is the ordinary problem with reading line movement after the fact: you see where it ended, not the path.
The March Price Was Not the Mistake
Easy to read all this as the market blowing a call. I don’t think that holds up.
The roster was real, and parts of it still are. ESPN notes Soto has produced at an MVP level since returning from an April calf injury, with rookie outfielders Carson Benge and A.J. Ewing looking like foundational pieces. The same preview attributes the wreckage to injuries and an offseason rebuild that failed to knit together, which describes variance and bad process rather than evidence that 13-1 was mispriced in March.
Seven percent means it fails 93 times out of 100. That’s what the number said, and a futures ticket buys exactly one draw from that distribution. The Mets got a rotten one. This is the same arithmetic that makes a longshot worth holding when the price is right, which is most of what the underdog philosophy on this site amounts to, just pointed the other direction. It reads differently when it’s the favorite failing and your money is on it.
The other end of the same board is worth a look too, since we wrote in early August about the Rays drawing almost no betting interest while holding one of the best records in baseball. Attention and price come apart in both directions. New York has 44 games left and sits 11 out with a number that implies 2.78 percent. Milwaukee, which CBS Sports flagged this summer as one of the standing exceptions to the payroll rule, woke up Sunday with the best record in baseball.